30 Promotional Products Statistics You Need in 2026
30 data-backed promotional products statistics covering ROI, consumer behavior, sustainability trends, and industry spending. Essential benchmarks for marketers planning 2026 campaigns.
If you are allocating marketing budget for 2026, you need to know whether promotional products deserve a line item — and if so, how much. The challenge is that promotional merchandise has historically been one of the hardest channels to measure. Unlike digital advertising, there is no dashboard showing impressions, click-through rates, or conversion funnels.
But the data exists. Industry organizations like PPAI, ASI, and SAGE have been tracking promotional products statistics for decades, and the research paints a clear picture: promotional products are not just surviving in a digital-first marketing landscape — they are outperforming many digital channels on cost efficiency and consumer recall.
This article compiles 30 of the most relevant promotional products statistics for 2026, organized into six categories: market size, ROI and cost efficiency, consumer behavior and recall, sustainability trends, product category performance, and channel comparison. Use these benchmarks to build your case, set budgets, and measure results.
Market Size and Industry Spending
Understanding the scale of the promotional products industry is the first step toward making informed budget decisions. These numbers establish context for everything that follows.
1. The U.S. promotional products market generated $26.1 billion in end-user spending in 2025. This represents consistent year-over-year growth of 3-4%, even as digital advertising budgets have flattened for many B2B marketers (PPAI).
2. Over 300,000 promotional products distributors operate in the United States. The distribution network spans from large national firms to independent local specialists, giving buyers a wide range of sourcing options (ASI).
3. The average mid-sized company spends $15,000 to $50,000 annually on promotional products. Enterprise-level organizations typically allocate $100,000 or more, particularly those with active event marketing and employee recognition programs (PPAI).
4. Promotional products represent roughly 8-12% of total marketing budgets for companies that use them. For B2B companies with field sales teams, this figure can rise to 15% when factoring in trade show materials and client gifting programs (SAGE).
5. North America accounts for approximately 45% of the global promotional products market, followed by Europe at 28% and Asia-Pacific at 19%. The remaining 8% is split across Latin America, the Middle East, and Africa (Global Industry Analysts, 2025).
6. The average order value for promotional product purchases is $2,340. However, this number varies significantly by product category — custom apparel orders tend to be larger, while small-batch corporate gifts skew lower (PPAI).
ROI and Cost Efficiency
Return on investment is where promotional products statistics get most persuasive — and where the case for promotional products ROI becomes undeniable. The key insight is that the per-impression cost of physical branded items is dramatically lower than most marketers assume.
7. The average cost-per-impression for a promotional product is $0.004. That is roughly one-tenth the cost of a digital display ad impression at $0.044 (PPAI, 2025).
8. Promotional products generate an average of 5,800 impressions per item over their usable life. Items kept longer — such as outerwear, bags, and drinkware — can generate significantly more (PPAI).
9. 83% of consumers say they can recall the advertiser on a promotional product they received. By comparison, only 33% can recall the advertiser from a digital display ad they saw in the past week (PPAI).
10. The average promotional product is kept for 6.6 months. Bags have the longest retention at 11 months, followed by outerwear at 14 months and drinkware at 8 months (PPAI).
11. Promotional products produce a higher ROI than both TV and radio advertising for B2B brand awareness campaigns. In PPAI's multi-channel comparison study, promotional products ranked second only to search engine marketing for brand recall among B2B decision makers (PPAI).
12. 89% of consumers who received a promotional product in the past 12 months could recall the advertiser's name. This compares to 76% for magazine ads and 58% for TV commercials (ASI).
13. 58% of consumers who receive a promotional product have a more favorable impression of the advertiser after receiving it. The effect is strongest when the product is useful, high-quality, and relevant to the recipient's daily life — a critical factor for measuring promotional products ROI (PPAI).
Consumer Behavior and Recall
What do people actually do with the promotional products they receive? These statistics reveal patterns that should influence your product selection and distribution strategy.
14. Bags are the most frequently used promotional product category, with 73% of recipients using them weekly. Tote bags, backpacks, and drawstring bags lead all categories in both usage frequency and impressions generated (PPAI).
15. 89% of consumers have a promotional product in their kitchen. Drinkware and food storage items dominate this space, making kitchens one of the highest-impact rooms for brand exposure (ASI).
16. 74% of consumers keep promotional products they receive at their workplace. Office-based items like pens, notepads, desk accessories, and bags ensure daily brand visibility in professional environments (PPAI).
17. Writing instruments generate the most total impressions of any product category — an average of 3,216 per month. Despite their low unit cost, pens deliver exceptional exposure because of how frequently they change hands (PPAI).
18. 85% of consumers who received a promotional product did business with the advertiser at some point afterward. The causation is not always direct, but the correlation between receiving branded merchandise and subsequent purchasing is strong (PPAI).
19. 63% of consumers pass along promotional products they no longer need to someone else. This "hand-me-down" effect extends the life of your marketing investment well beyond the original recipient (ASI).
20. 48% of consumers would like to receive promotional products more often. Far from being seen as clutter, branded merchandise is welcomed by nearly half of all consumers when the items are practical and well-made (PPAI).
21. The top reason consumers keep promotional products is usefulness (77%), followed by attractiveness (53%) and quality (41%). Items that fail on any of these three criteria are discarded quickly (PPAI).
22. 69% of consumers have picked up a promotional product at a trade show — and 72% of those attendees can recall the booth where they received it. This makes trade show giveaways one of the highest-recall distribution channels available (ASI).
Sustainability and Eco-Friendly Trends
Sustainability has moved from a nice-to-have to a baseline expectation. These statistics show how consumer preferences are shifting and what it means for promotional product strategies in 2026.
23. 46% of consumers say receiving an eco-friendly promotional product improves their perception of the brand. The number jumps to 62% among consumers aged 18-34 (PPAI, 2025).
24. Demand for sustainable promotional products grew 28% year-over-year in 2025. Recycled materials, organic cotton, and biodegradable packaging are the fastest-growing product attributes (SAGE).
25. 72% of consumers say a company's environmental practices influence their purchasing decisions. When that company hands them a 100% Recycled RPET Shopper Tote at an event, the alignment between brand values and physical product creates a memorable impression (PPAI).
26. The average price premium for eco-friendly promotional products has dropped to 8-15% over conventional alternatives. As production scales up, the cost barrier to sustainable merchandise continues to narrow (SAGE, 2025).
Product Category Performance
Not all promotional products perform equally. Understanding which categories deliver the best retention, usage, and recall helps you allocate budget to the items with the highest impact — and maximize your promotional products ROI.
27. Tote bags deliver the best cost-per-impression among high-visibility categories at $0.0002 per impression. A standard 12oz Cotton Canvas Tote generates an estimated 11,400 impressions over an average 11-month lifespan (PPAI). Writing instruments edge out bags on raw cost-per-impression at roughly $0.00004, but bags dominate on total visibility and perceived value — see the cost-per-impression breakdown by product for the full math.
Here is a comparison of the top product categories by key performance metrics:
| Product Category | Avg. Lifespan | Impressions/Month | Total Impressions | Typical Unit Cost | Cost-Per-Impression |
|---|---|---|---|---|---|
| Tote Bags | 11 months | 1,038 | ~11,400 | $2.50 | $0.0002 |
| Writing Instruments | 4 months | 3,216 | ~12,860 | $0.50 | $0.00004 |
| Drinkware | 8 months | 847 | ~6,800 | $3.00 | $0.0004 |
| Bags (all types) | 9 months | 1,022 | ~9,200 | $3.50 | $0.0004 |
| Outerwear | 14 months | 643 | ~9,000 | $12.00 | $0.0013 |
| Calendars | 12 months | 271 | ~3,250 | $1.00 | $0.0003 |
28. Backpacks are the fastest-growing promotional product category for B2B audiences, with demand increasing 15% year-over-year. Items like the Affordable Crossbody Backpacks appeal to both younger employees and professionals who commute, making them a versatile choice for employee onboarding kits and corporate gifts (SAGE, 2025).
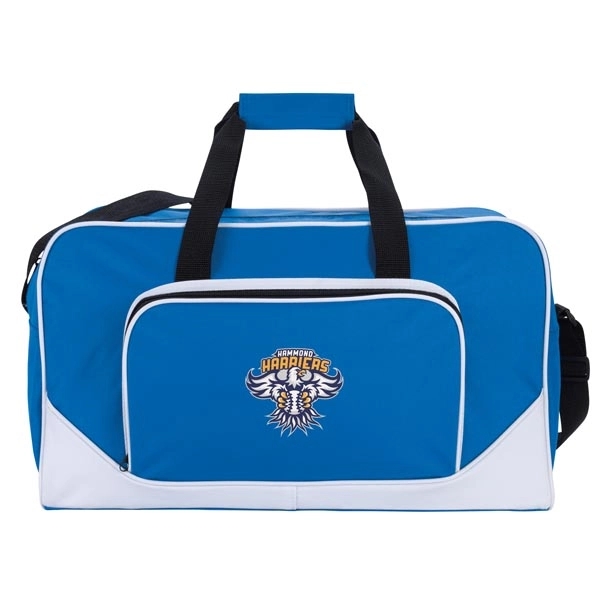
29. Duffel bags and sports bags have the highest perceived value among recipients in the $5-$15 price range. A Team Spirit 600D Polyester Duffel generates strong brand association because it is used in visible, active environments — gyms, sports leagues, and weekend travel (PPAI).
Promotional Products vs. Other Marketing Channels
How does physical branded merchandise stack up against the marketing channels that dominate most budgets?
30. Promotional products rank among the top three most effective advertising mediums across all age groups. In head-to-head comparisons, they outperform TV, radio, print, and most digital formats for brand recall and favorable impression, trailing only internet search and word-of-mouth referrals (PPAI).
Quick comparison: Promotional products vs. digital advertising
| Metric | Promotional Products | Digital Display Ads | Social Media Ads |
|---|---|---|---|
| Avg. Cost-Per-Impression | $0.004 | $0.044 | $0.029 |
| Brand Recall (after 1 week) | 89% | 33% | 45% |
| Positive Brand Impression | 58% | 12% | 22% |
| Ad Blocking / Ignored | 0% | 42.7% (ad blockers) | 86% (banner blindness) |
| Average Lifespan of Exposure | 6.6 months | Single session | Single session |
| Secondary Audience Exposure | Yes (pass-along) | No | Limited (shares) |
The most important takeaway is not that promotional products are universally better than digital advertising. It is that they complement digital campaigns by providing a physical, persistent touchpoint that digital ads cannot deliver.
Recommended Products
The promotional products that consistently deliver the best results are those that combine utility, visibility, and durability. These five products represent strong performers across the statistics cited in this article:
-
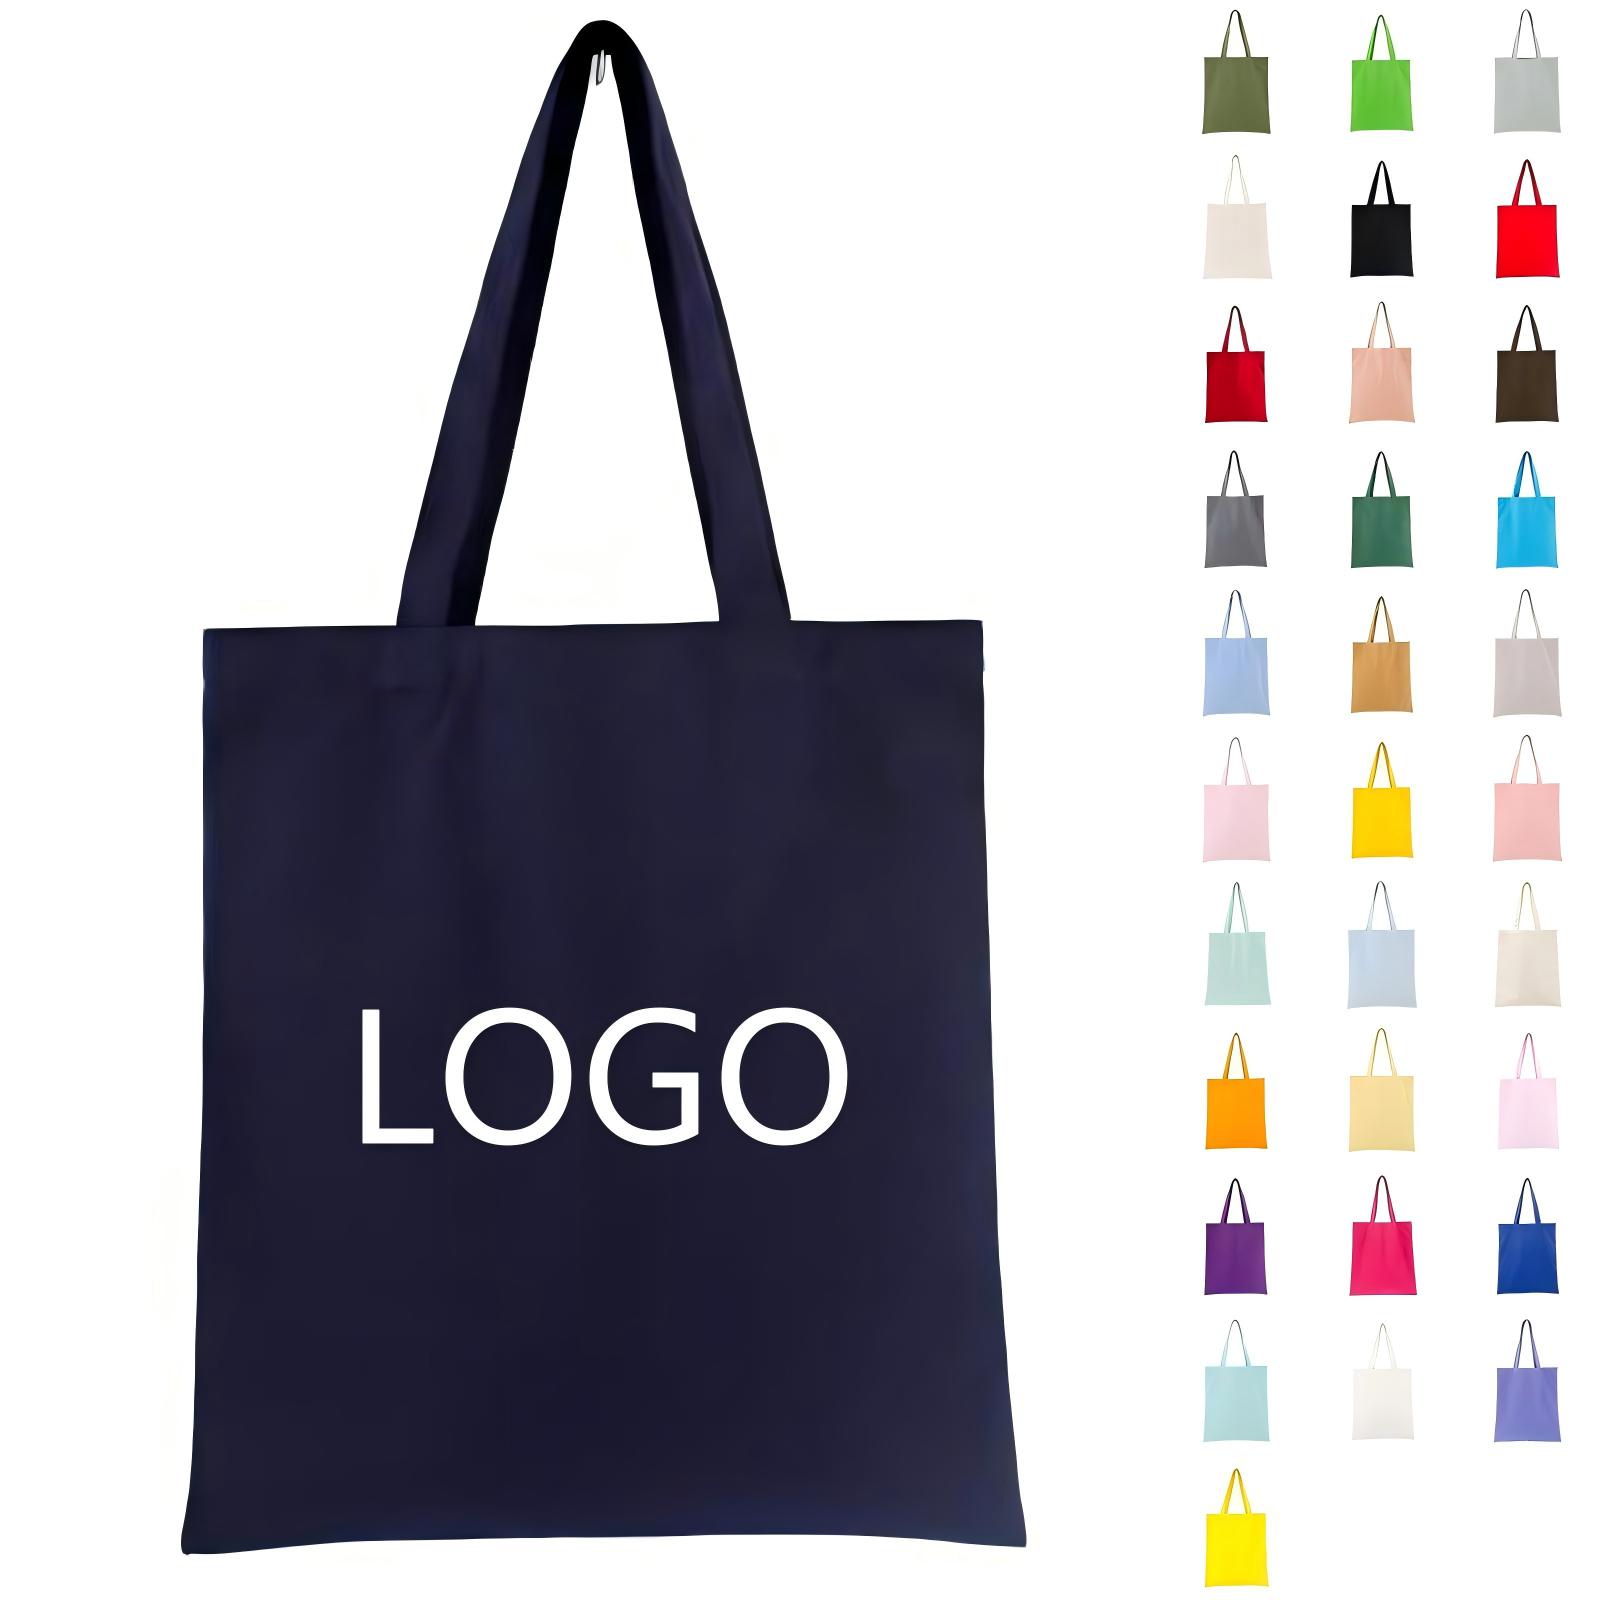
Standard Vertical Style 12oz Cotton Canvas Totes — The highest cost-per-impression value in the industry. Tote bags generate an average of 11,400 impressions over 11 months and are the single most-used promotional product category.
-
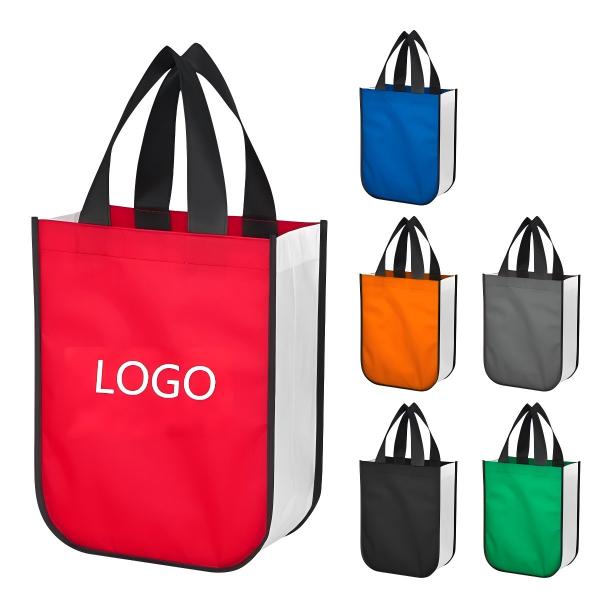
100% Recycled RPET Shopper Totes — Meets growing consumer demand for sustainable merchandise while delivering the same bag-category performance metrics as conventional totes.
-
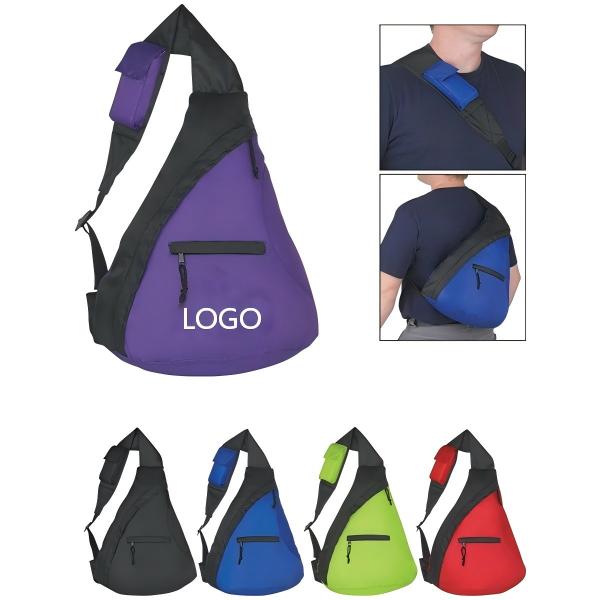
Affordable Crossbody Backpacks — The fastest-growing B2B promotional product category, appealing to commuting professionals and younger employees. Strong retention and daily usage.
-
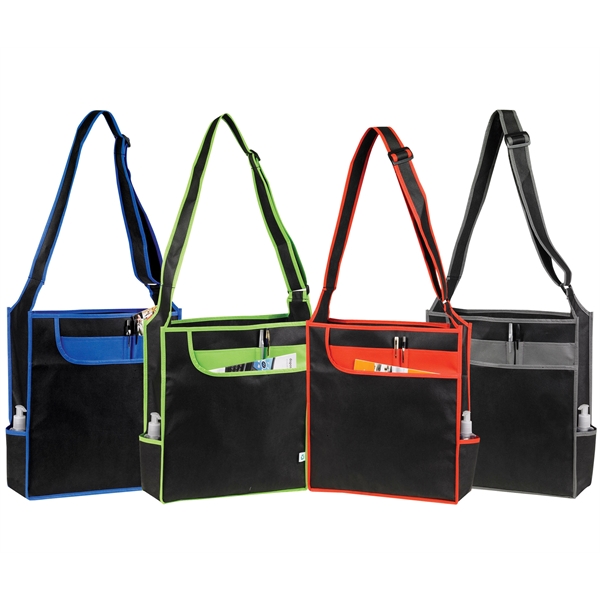
Professional Organizer Messenger Tote — Delivers brand exposure in high-value professional environments: client meetings, conferences, and daily commutes. The organizer design ensures long-term retention.
-
Team Spirit 600D Polyester Duffel — Generates visible brand impressions in active, social settings. Duffel bags rank high for perceived value and are frequently shared among household members.
If you are planning a 2026 promotional products campaign, request samples to evaluate quality before committing to a larger order. The statistics show that product quality directly correlates with retention, recall, and brand perception.